
Exploring Germany's
Urban Geography with
Census & OpenStreetMap
Data
Presented by:
Travis Hathaway
For:
PyCon DE & PyData Darmstadt 2026
Who am I?
- Professional software engineer 💻
- Amateur social scientist 📚
-
Work at Anaconda on conda packaging 📦
![Anaconda logo]()
![Conda logo]()

Travis Hathaway
(a.k.a. pretty chill guy)
Our unsung hero
- Lenovo ThinkStation P340
- 32GB of RAM, 16 Cores
- Has promised not to join coming robot
rebellion against humans 🤝

"thath" Station
(definitely not a killer robot)
Today, I'll teach you to think like an urban geographer.
To show how, I share my personal journey to assess emergency medical accessibility in Germany.

examines various aspects of urban life and the built environment from physical, social and economic perspectives
Physical environment
- Urban sprawl and land use patterns
- Infrastructure like transportation networks, utilities, and public spaces
- Evolution of city layouts over time

Photo from Denys Nevozhai on Unsplash
Social & Cultural
- Equitable distribution of resources
- City vibrancy/livability
- Nature of public space
By Utcursch - Own work, CC BY-SA 4.0, on wikimedia
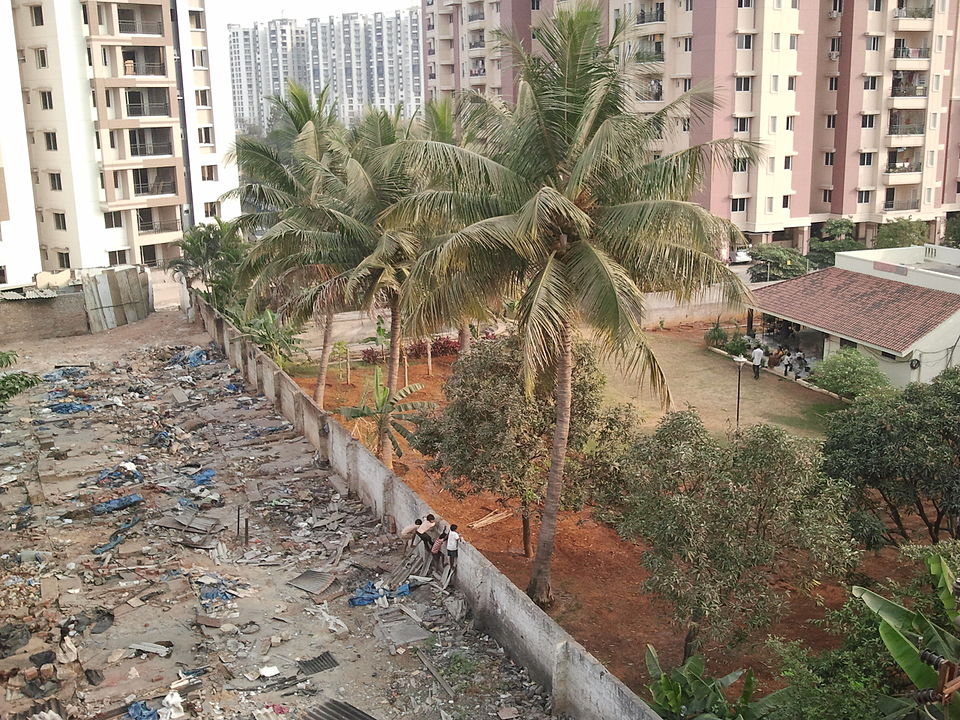
Urban Processes
- Urbanization and de-urbanization
- Gentrification
- Effects of natural processes on urban spaces
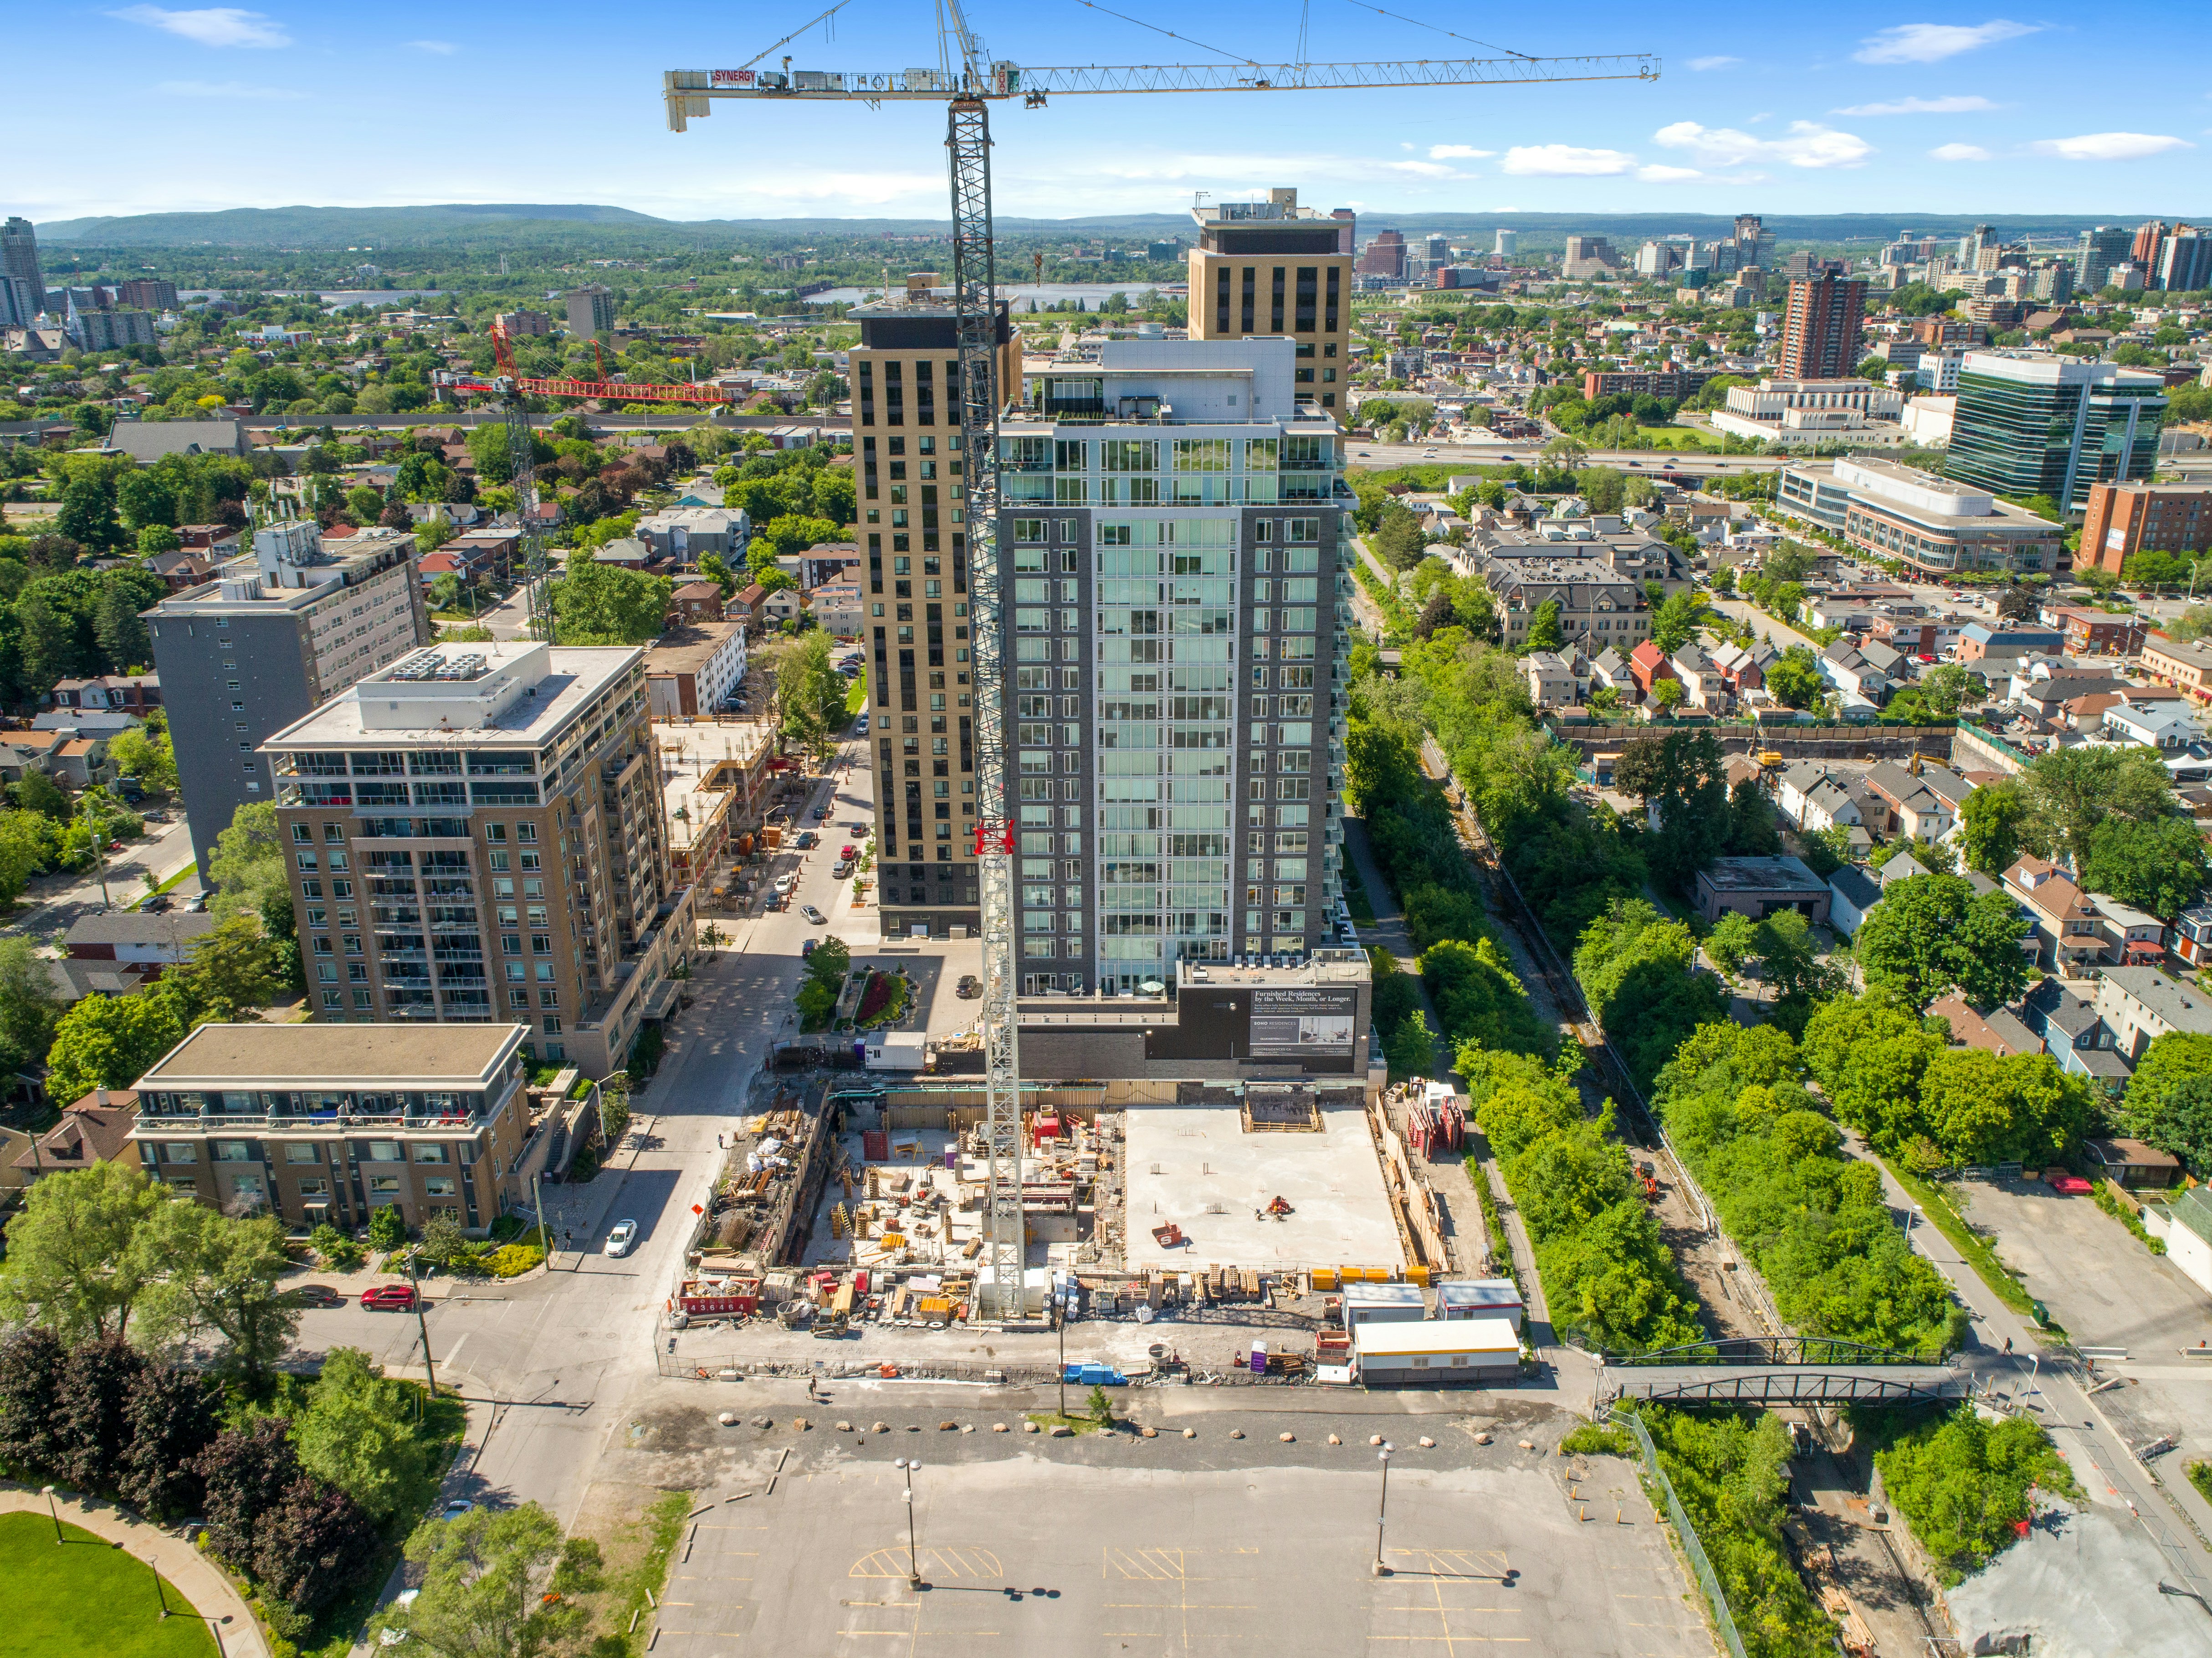
Photo from Point3D Commercial Imaging Ltd. on Unsplash

Lay the foundation

Ask meaningful questions

Analyze and present
Lay the foundation

- Data available at 10km, 1km and 100m resolutions
- Demographic data including population age and immigration background
- Raw data available as CSV files
CSVs are fine but I prefer PostgreSQL!

That's why I created
zensus2pgsql
| zpg list | List available datasets |
| zpg create | Download and imports dataset |
| zpg drop | Remove all census tables from database |
Table showing population in 5 age groups at 100m resolution
					Table "zensus.alter_in_5_altersklassen_100m"

				         Column         |         Type
				------------------------+----------------------
				 gitter_id_100m         | text
				 insgesamt_bevoelkerung | integer
				 unter18                | integer
				 a18bis29               | integer
				 a30bis49               | integer
				 a50bis64               | integer
				 a65undaelter           | integer
				 geom                   | geometry(Point,3035)
To install yourself...
						# Install via conda/pixi
						pixi global install zensus2pgsql
						conda install -c conda-forge zensus2pgsql

						# Install via pip/uv
						pip install zensus2pgsql
						uv add zensus2pgsql
More tools and data will be needed...
OpenStreetMap
PgOSM Flex
pgosm-flex
- Offers an opinionated view of how OSM data should be represented in PostgreSQL
- Can be used to import entire country's worth of data
- Very useful for exploratory analysis
Provides neatly organized tables
												List of tables
	   Schema  |           Name           | Type  |  Owner
	-----------+--------------------------+-------+----------
	 osm       | amenity_line             | table | user
	 osm       | amenity_point            | table | user
	 osm       | amenity_polygon          | table | user
	 osm       | building_point           | table | user
	 osm       | building_polygon         | table | user
	 osm       | poi_line                 | table | user
	 osm       | poi_point                | table | user
	 osm       | poi_polygon              | table | user
 	...
Columns are also easy to reason about
									Table "osm_germany.amenity_polygon"
					     Column      |            Type
					-----------------+-----------------------------
					 osm_id          | bigint
					 osm_type        | text
					 osm_subtype     | text
					 name            | text
					 housenumber     | text
					 street          | text
					 city            | text
					 state           | text
					 postcode        | text
					 address         | text
					 wheelchair      | text
					 geom            | geometry(MultiPolygon,3035)
What can you do with this data?
How many REWEs
does Germany have?
WITH rewes AS (
    SELECT
        ST_Centroid(poly.geom) as geom
    FROM osm.poi_polygon poly
    WHERE
        name ~* '^rewe'
        AND name !~* '(to go|express|getränke|abhol)'
        AND osm_type = 'shop'
        AND osm_subtype = 'supermarket'
    UNION ALL
    SELECT geom
    FROM osm.poi_point pt
    WHERE
        name ~* '^rewe'
        AND name !~* '(to go|express|getränke|abhol)'
        AND osm_type = 'shop'
        AND osm_subtype = 'supermarket'
)
SELECT COUNT(*) FROM rewes;
So, how many REWEs are there?
3,750
Compared to official numbers...
~3.800
source: www.rewe-group.com
At 0.74 REWEs per 10k, Hessen has the highest per capita, and at 0.25, Sachsen-Anhalt has the lowest.
Ask meaningful questions
Meaningful research questions...
- Account for previous research
- Fit within your desired field of study
- Add to the existing body of knowledge
- Bonus points for picking something topical!🌟
Spacial Accessibility
- Focuses on distribution and availability of crucial amenities in urban environments
- Can be used as a way to promote equitable distribution
- Studies often use a data-driven, GIS analysis
Picking a topic
- Germany as the study area
- Spacial accessibility as investigation
- Specific amenity as the thing to focus on
Hospitals
Krankenhaus-
versorgungs-
verbesserungs-
gesetz

Germany 🇩🇪: Health Expenditure as % of GDP (2015-2024)
Source: OECD Health Statistics
Health Expenditure as % of GDP — Top 10 OECD Countries (2024)
Source: OECD Health Statistics
Hospital beds per 1,000 inhabitants in Europe
Source: OECD Health Statistics
RQ1 How does travel time to emergency medical services vary across age groups in Germany, and do older age cohorts experience systematically greater or lesser access to higher-lever facilities?
Almost ready for the analysis!
Just need to figure out where
these hospitals are...
WITH hospitals AS (
	SELECT
		ST_Centroid(poly.geom) as geom
	FROM osm.poi_polygon poly
	JOIN osm.tags t
	ON abs(t.osm_id) = poly.osm_id
	WHERE
		t.tags ->> 'emergency' = 'yes'
		AND
		osm_subtype = 'hospital'
	UNION ALL
	SELECT geom
	FROM osm.poi_point pt
	JOIN osm.tags t
	ON abs(t.osm_id) = pt.osm_id
	WHERE
		t.tags ->> 'emergency' = 'yes'
		AND
		osm_subtype = 'hospital'
)
SELECT count(*) FROM hospitals;
823


1,113
							      Table "public.hospitals"

  						 Column       |         Type
  						--------------+----------------------
  						 id           | integer
  						 name         | text
  						 address      | text
  						 care_level   | text
  						 geom         | geometry(Point,3035)
Analyze
and
present
Open, Reproducible Science
- Prioritize writing software that can be adapted and reused
- Published under a permissive license (MIT)
- Organized into a CLI program
emsde
| emsde analyze | Run analysis for travel cost calculation |
| emsde report | Generate a report that can be adapted for multiple output formats |
The last tool needed...

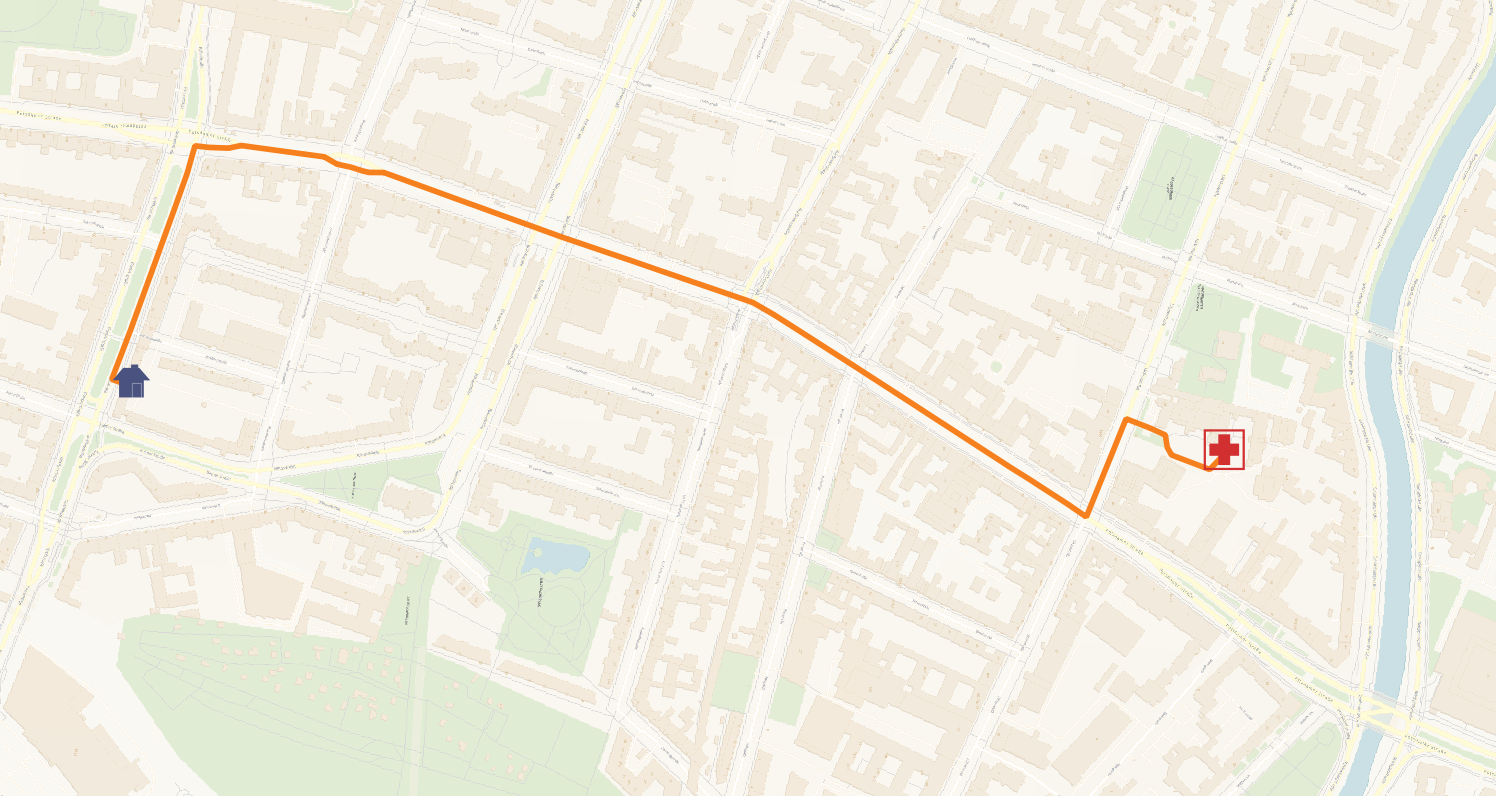
Straight line distance
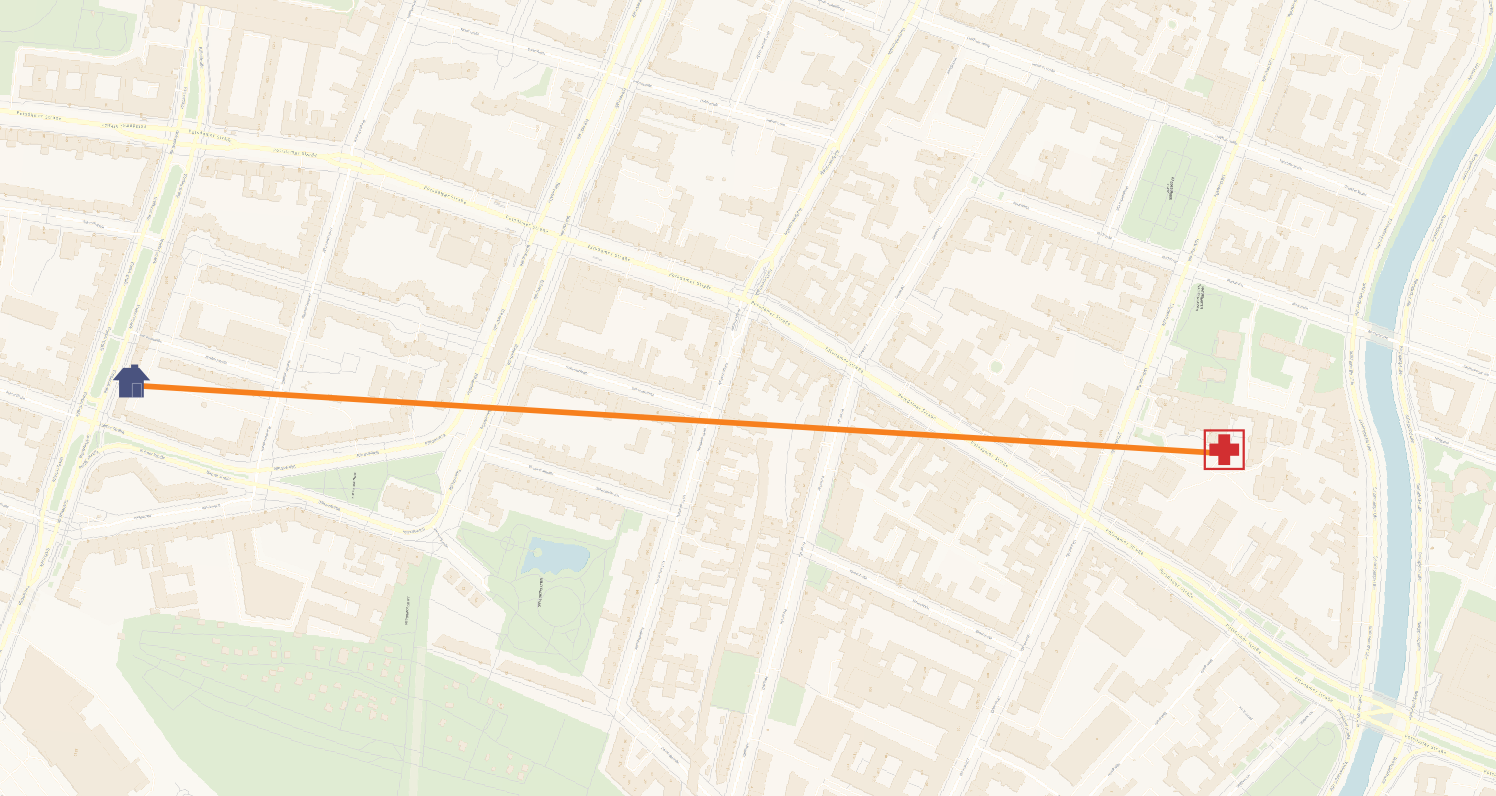
Network distance
Now for the results... 🥁
Share of population within thresholds for any hospital
All age groups
Minimal difference
Insignificant difference
Age split for percent of pop within 15 mins
Share of population within thresholds by hospital care level
Coverage by hospital level and age group
RQ1 Based on this analysis, we can conclude there is no significant difference in access across ages groups when we consider Germany as a whole.
⚠️ Limitations ⚠️
- Does living closer to a hospital actually improve health outcomes?
- Important not to draw concrete conclusions from these analysis
- These tools simply hint at where we might look further
- They are only as good as the data we feed them
How do I get involved?
-
Join your local OpenStreetMap group!
OpenStreetMap DE - Find a local data science for good organization!
- Focus on local issues and share your research at community meetups!
All of this would not be possible without these amazing open-source projects:
PgOSM
Flex
Project
About Me

https://pyconde2026.thath.net/links.html
Exploring Germany's Urban Geography with Census & OpenStreetMap Data | PyCon DE 2026 | Travis Hathaway